Back Komparative Statik German Estática comparativa Spanish Statica comparata Italian 比較静学 Japanese Comparatieve statica Dutch Estática comparativa Portuguese

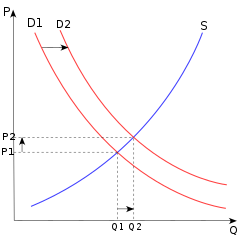
In economics, comparative statics is the comparison of two different economic outcomes, before and after a change in some underlying exogenous parameter.[1]
As a type of static analysis it compares two different equilibrium states, after the process of adjustment (if any). It does not study the motion towards equilibrium, nor the process of the change itself.
Comparative statics is commonly used to study changes in supply and demand when analyzing a single market, and to study changes in monetary or fiscal policy when analyzing the whole economy. Comparative statics is a tool of analysis in microeconomics (including general equilibrium analysis) and macroeconomics. Comparative statics was formalized by John R. Hicks (1939) and Paul A. Samuelson (1947) (Kehoe, 1987, p. 517) but was presented graphically from at least the 1870s.[2]
For models of stable equilibrium rates of change, such as the neoclassical growth model, comparative dynamics is the counterpart of comparative statics (Eatwell, 1987).
- ^ (Mas-Colell, Whinston, and Green, 1995, p. 24; Silberberg and Suen, 2000)
- ^ Fleeming Jenkin (1870), "The Graphical Representation of the Laws of Supply and Demand, and their Application to Labour," in Alexander Grant, Recess Studies and (1872), "On the principles which regulate the incidence of taxes," Proceedings of the Royal Society of Edinburgh 1871-2, pp. 618-30., also in Papers, Literary, Scientific, &c, v. 2 (1887), ed. S.C. Colvin and J.A. Ewing via scroll to chapter links.
© MMXXIII Rich X Search. We shall prevail. All rights reserved. Rich X Search